
When a critical system fails, the clock starts ticking and so does the counter on revenue loss. Are you prepared with the right recovery metrics?
In recent years, high-profile outages have highlighted the need for clearly defined RTO and RPO targets. In early 2025, Barclays Bank suffered a multi-day IT outage that disrupted online banking, card transactions, and ATMs, resulting in an estimated £7.5 million in customer compensation. Similarly, in October 2023, a data center cooling failure impacted DBS and Citibank in Singapore, resulting in more than 2.5 million failed payment and ATM transactions. These real-world failures illustrate the immense financial and reputational risks tied to insufficient recovery planning.
As software architects and developers, we build the digital infrastructure that powers modern business. Yet too often, our disaster recovery planning relies on vague assurances rather than measurable standards. Let’s change that by mastering two critical metrics: Recovery Time Objective (RTO) and Recovery Point Objective (RPO).
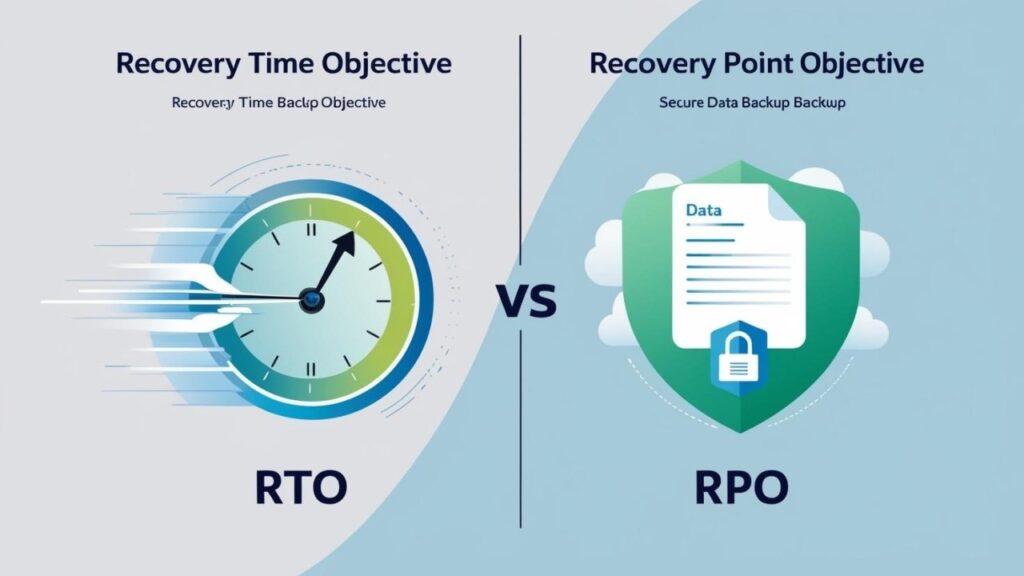
RTO vs. RPO: The Twin Pillars of Disaster Recovery
Recovery Time Objective (RTO) answers: “How quickly must our systems be restored after a disruption?”
Recovery Point Objective (RPO) answers: “How much data loss can our business tolerate?”
While seemingly straightforward, these metrics require careful calibration based on business needs, technical constraints, and financial realities. Let me show you how to approach them systematically.
Quantifying Business Impact: The Foundation of Meaningful
RTOs
Too many organizations set arbitrary RTOs (“four hours sounds good”) without understanding the true cost of downtime. Here’s a simple formula to calculate hourly downtime cost:
Hourly Revenue Loss = (Annual Revenue / Annual Business Hours) + Employee Productivity Cost + Reputation Cost + Compliance Penalties
For a SaaS business generating $50M annually:
- Revenue impact: ~$5,700/hour
- Lost productivity: $2,000/hour (20 engineers × $100/hour)
- Customer churn: Varies, but often 5-10× the direct revenue loss
- Compliance penalties: Potentially $50,000+ per incident
With this understanding, we can set appropriate RTOs that balance cost against recovery investment.
Mapping Your Data Value Curve for Precise RPOs
Data value typically decays over time, but the curve varies dramatically by business function:
Transaction processing systems: Value drops precipitously (near-zero RPO)
Inventory management: Moderate decay (15-30 minute RPO)
Analytics platforms: Gradual decay (4-24 hour RPO)
Rather than setting a blanket RPO, map these curves for each system to allocate resources efficiently.
Architectural Patterns That Deliver on RTO/RPO Promises
Once targets are established, we need architectures that can actually meet them. Consider these patterns based on your requirements:
For Near-Zero RPO Systems (< 5 minutes)
- Synchronous multi-region replication
- Transaction log shipping with continuous restore
- Active-active deployments with distributed consensus
For Low-RTO Systems (< 15 minutes)
- Auto-scaling instances with infrastructure-as-code
- Blue-green deployments with rapid cutover capabilities
- Containerized applications with orchestrated recovery
For Standard Business Systems (< 4 hours)
- Regular backups with automated restore testing
- Warm standby environments
- Database replication with point-in-time recovery
Common Pitfalls
Having defined metrics and architectural patterns, we must still bridge the implementation gap. Watch for these common pitfalls:
- Untested recovery processes: Many organizations discover their RTOs are fantasy during an actual disaster. Schedule quarterly recovery drills.
- Dependency blindness: Your system can’t recover faster than its slowest dependency. Map all dependencies and include them in your recovery planning.
- Configuration drift: Recovery environments often drift from production, invalidating your RTOs. Implement infrastructure-as-code to maintain parity.
- Data inconsistency: Asynchronous replication can lead to logical data corruption. Implement application-level consistency checks during recovery.
- Authentication failures: Nothing kills your RTO faster than authentication systems being unavailable. Ensure identity management has the most robust a recovery process.
Measuring and Improving Recovery Metrics
To continually improve your RTO/RPO performance:
- Instrument your recovery process: Track actual recovery times with detailed success/failure metrics
- Conduct blameless postmortems: After each incident, document what worked and what didn’t
- Automate aggressively: Human intervention inevitably increases RTO
- Test incrementally: Regular testing of smaller components reduces risk while validating assumptions
Conclusion: From Metrics to Mindset
RTO and RPO aren’t just technical metrics they’re a mindset that transforms how we build resilient systems. By quantifying recovery objectives and designing architectures to meet them, we shift from reactive crisis management to proactive resilience engineering.
The questions I leave you with:
- Have you calculated the true cost of downtime for your critical systems?
- When was the last time you actually tested your recovery process end-to-end?
- Are your RTOs and RPOs aligned with business priorities or technical convenience?


